Engineering Wholesale
Market Mechanics
We engineer institutional-grade analytical tools for NinjaTrader 8 and standalone market simulation environments. Designed to decode market structure, track wholesale inventory, and visualize algorithmic reactions to order flow with uncompromising clarity.
Feature Previews
EdgeTracker TPO NinjaTrader 8 Indicator
An institutional-grade TPO Market Profile analytics engine. Designed to visualize trapped inventory, structural market anomalies, and real-time wholesale positioning.
EdgeTracker Essential
- ✓ Professional Market Profile Analytics
- ✓ Laptop-Friendly Engine
- ✓ Optimized for Futures market
- ✓ Intraday Volume Analysis
- ✓ Selection of Color Themes
- ✓ Auto-Ticks Per Level
- ✓ Custom Right Click Menu
EdgeTracker Pro
- ✓ Everything in Essential
- ✓ Real-Time Order Flow Visuals
- ✓ 1m/5m Timeframe Execution
- ✓ Tape Velocity Metrics
- ✓ Multi TF-Situational Awareness
- ✓ Structural Edge Case Detection
- ✓ Detailed Volumetrics
Select a variant above to deploy the technical specification sheet.
EdgeTracker Essential
EdgeTracker Pro
| Features | Essential | Pro |
|---|---|---|
| Time Price Opportunity (TPO) Engine | Included | Included |
| Dynamic Session Splitting | Included | Included |
| Composite Volume Profile (CVP) | Included | Included |
| Sidecar Volume Profiles | Included | Included |
| Micro-Structural Anchors | Included | Included |
| Session, Daily & Anchored VWAP | Included | Included |
| Real-Time Bid/Ask Visualizer | Not Included | Included |
| 1/5m Execution Lens | Not Included | Included |
| Velocity Meter | Not Included | Included |
| Granular Order Flow Profiles | Not Included | Included |
| Horizontal Timeline Volume Profile | Not Included | Included |
| Edge Case Detection | Not Included | Included |
Essential Features
Core TPO Profiling Engine
Gain immediate clarity on time acceptance. The engine renders Time Price Opportunity (TPO) Letters and colored background boxes simultaneously, mapping exactly where participants are actively building their cost basis.
Dynamic Session Splitting
Maintain absolute structural purity. By separating the daily auction into independent Regular Trading Hours (RTH) and Electronic Trading Hours (ETH) profiles, this ensures overnight inventory never skews your primary day-session analysis.
Composite Volume Profile (CVP)
Track macro inventory shifts across larger timeframes. The CVP aggregates days or weeks of volume into a grander structural histogram, utilizing day-based color ranking to instantly separate recent participation from historical volume.
Sidecar Volume Profiles
Monitor the active ledger of the current session's inventory migration. These elastic volume profiles anchor directly to the TPO structure, scaling dynamically to guarantee an accurate visual representation of relative inventory size across all sessions.
Micro-Structural Anchors
Pinpoint the auction's shifting center of gravity. The engine tracks the immediate migration of volume within the profile, utilizing the Cumulative Developing POC (dPOC) and 1-Minute precision VWAP to map chronological inventory shifts as they happen.
Fluid Visual Performance: We bypassed the standard rendering limits of NinjaTrader to prioritize visual precision. Our graphics pipeline handles the complex Market Profile geometry—including Value Area expansion, POC shifts, and TPO structure—directly via the GPU. The result is fluid, 60 FPS responsiveness, even during rapid chart movement. Your interface stays hyper-responsive and crisp, maintaining system efficiency, even on standard laptop hardware.
Independent Data Handling: Heavy historical data usually suffocates traditional platforms because they process visual math and incoming data on the same line. EdgeTracker handles these processes independently. Real-time TPO data streams are isolated from historical analysis, meaning you can load months of high-resolution profile data without ever causing the primary chart or UI to "hang" or freeze.
Smart Market Mapping: Instead of relying on heavy, resource-intensive looping to define your sessions, our engine uses lean, purpose-built logic. Essential market intelligence—including real-time tracking of the Developing POC & VA (dPOC & VA) alongside the Isolated 30m POC & VA (IsoPOC & VA)—is mapped through high-efficiency internal arrays. This provides institutional-grade precision in your profile development without the computational bloat that plagues competitive suites.
Select Version
Pro Features
The Execution Lens
Traditional TPO frameworks force a visual disconnect—planning the macro context on a 30-minute profile while executing on a separate 1-minute chart. The Execution Lens bridges this gap. It embeds a localized, micro-structural view directly adjacent to the active price action. Featuring dedicated 1-minute, 5-minute, and Hybrid modes, it allows you to maintain your higher-timeframe structural mapping while simultaneously tracking granular volume, bid / ask split, and horizontal bar based volume profiles. You get precise execution timing without ever breaking your line of sight from the macro trend.
Real-Time Bid/Ask Visualizer
Observe the live execution boundary tick-by-tick. Independent vertical Bid & Ask units display resting limit orders and active quotes, while an aggression overlay flashes and accumulates incoming market hits in real-time.
Velocity Meter
Measure true execution speed. Functioning as an algorithmic pacing tracker, this segmented horizontal meter illuminates sequentially across four overlapping color tiers, allowing you to visually identify moments of extreme tape velocity instantly.
Granular Order Flow Profiles
Analyze structural volume with absolute precision. The engine supports up to three independent volume profile slots rendered simultaneously, with customazible timeframes, featuring explicit visual modes including Bid/Ask profile, Vertical Delta Split, and Horizontal Thermal Delta.
Timeline Volume Profile
Classic horizontal Volume Profile to accomodate the Execution Lens 1m/5m timeframes, independant of NT8 native timeline. These volume profiles anchor directly to a custom-drawn timescale, supporting delta-based bars showing negative/postive inbalance.
Edge Case Detection
Automate the tracking of structural anomalies and auction failures. The engine dynamically maps Single Print zones, strong rejection tails (Excess Zones), and blunt auction terminations (Weak and Poor Extremes), invalidating zones automatically the moment price trades through them.
Fluid Visual Performance: We bypassed the standard rendering limits of NinjaTrader to prioritize visual precision. Our graphics pipeline handles the complex Market Profile geometry—including Value Area expansion, POC shifts, and TPO structure—directly via the GPU. The result is fluid, 60 FPS responsiveness, even during rapid chart movement. Your interface stays hyper-responsive and crisp, maintaining system efficiency, even on standard laptop hardware.
Independent Data Handling: Heavy historical data usually suffocates traditional platforms because they process visual math and incoming data on the same line. EdgeTracker handles these processes independently. Real-time order flow streams are isolated from historical analysis, meaning you can load months of high-resolution session tick data without ever causing the primary chart or UI to "hang" or freeze.
Smart Market Mapping: Instead of relying on heavy, resource-intensive looping to identify structural anomalies, our engine uses lean, purpose-built logic. Critical auction market data—such as Single Prints, Poor Lows, and Excess—is identified and tracked through high-efficiency internal arrays. This provides institutional-grade precision in your market mapping without the computational bloat that plagues competitive suites.
Select Version
EdgeTracker Pro
Drawing Tools Engine
Proprietary drawing components for NinjaTrader 8 are currently undergoing beta testing.
MarketMaker Pro Wholesale Trading Simulator
A standalone training environment where you step into the role of a wholesale operator. Manage the book, control the inventory, and build structural market mechanics from the inside out.
Currently In Development
The Standalone Market Simulator is currently in the active build phase. Check back or contact support for enterprise release timelines.
The Wholesale Edge
Understanding the actual mechanics of trading and the institutional inventory distribution that physically designs the chart.
Abandoning Retail Noise
Most standard retail trading interfaces rely heavily on lagging indicators. Moving averages, oscillators, and delayed calculations smooth out the exact granular data required for precise execution.
By relying on historical averages, they generate delayed signals, which inherently increases the risk of late entries. True market analysis requires an unfiltered view of the raw data, replacing predictive shortcuts with a direct observation of volume distribution and market mechanics.
The Mechanics of Trapped Inventory
Markets are fluid, multi-timeframe interactions driven by continuous order flow, sentiment, and the necessity to manage positions. During any rotational range, a specific percentage of inventory becomes trapped on the wrong side of an eventual breakout.
Well-capitalized participants will often hold these offside positions, absorbing the drawdown, waiting for price to retest the boundary so they can mitigate losses or scratch the trade at break-even. Shorter-term participants reacting to these movements provide the necessary liquidity for this mitigation to occur. Understanding this mechanical ebb and flow is the only way to accurately map the true path of least resistance.
Experience Dictates Analysis
Market awareness cannot be acquired purely through passive observation—it requires a direct understanding of cause and effect. Learning how significant volume interacts with the limit book teaches you exactly how trapped inventory dictates price action.
Translating an understanding of these mechanics back to the live tape fundamentally changes how you analyze a TPO profile. It provides absolute clarity on algorithmic reactions, revealing not only the price levels that offer the lowest-risk entries, but more importantly, exactly when the current risk profile dictates staying out of the market entirely.
Engineering Absolute Clarity
Processing high-frequency tick data and continuous volume requires uncompromising software architecture. Standard indicators often rely on inefficient scripts that bottleneck the platform and introduce severe chart lag during volatile conditions.
We reject these limitations. Our infrastructure within NinjaTrader 8 is engineered to bypass software bottlenecks by utilizing direct hardware acceleration. By strictly managing how data is processed in the background, we eliminate the CPU processing spikes that freeze your screen. The result is an ultra-lightweight engine that maintains absolute clarity and zero UI lag, even during the most extreme market volatility.
Platform Documentation
Technical manuals, installation routing, and algorithmic philosophy.
EdgeTracker TPO
Section 1: Installation & Data Management
From your NinjaTrader 8 Control Center, navigate to Tools → Import → NinjaScript Add-On. Select the EdgeTracker .zip file you downloaded. Follow the standard prompts to complete the installation.
EdgeTracker utilizes a secure, custom Cloudflare agent to handle automated key generation and ensure near-instant activation.
To activate: apply the indicator to your chart, then paste your License Key into the "License Key" field within the indicator's properties menu. The engine will automatically perform a secure, one-time handshake to bind your key to your machine's unique hardware identifier. Activation is immediate and requires no manual submission of machine IDs.
Before clicking OK to load the indicator onto your chart, locate the General Settings within the properties menu. You must manually verify or configure your specific Regular Trading Hours (RTH) start and end times. This is a critical structural step. These time inputs act as the master template that splits your daily auction into distinct RTH and ETH profiles. Because traditional TPO methodology relies on specific institutional open and closing times, such as 0930 for the cash open and 1700 for the full daily close, setting these exact parameters ensures your session transition times are accurate before the engine even begins calculating.
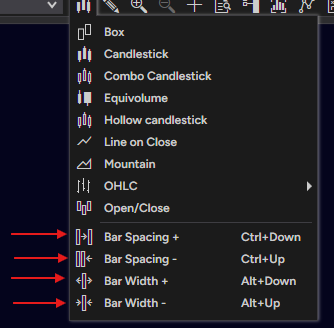
EdgeTracker utilizes NinjaTrader's native bar coordinates to construct the structural width of the TPO profiles. If your profiles appear heavily overlapped, clustered, or too narrow upon loading, you must adjust the native Bar Width and Bar Spacing controls (typically found in your top NinjaTrader toolbar). Decreasing Bar Width and increasing Bar Spacing provides the engine with the necessary horizontal canvas to render the profiles and sidecars cleanly.
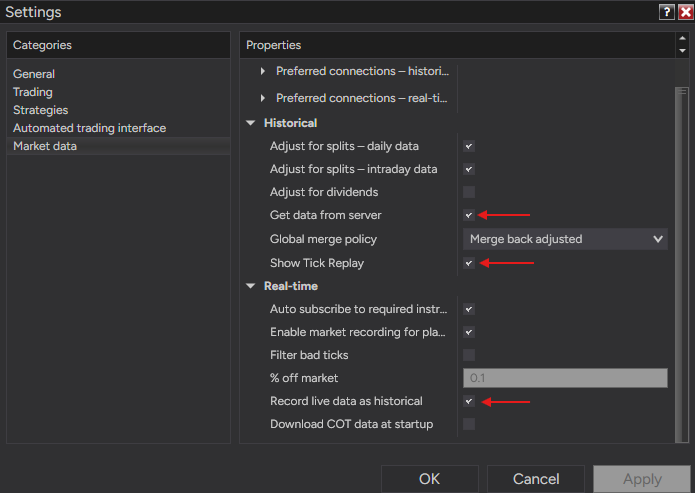
To calculate precise bid and ask volumes, EdgeTracker requires tick-level historical data. You must configure NinjaTrader's global settings to allow and record this data stream. From the NinjaTrader Control Center, navigate to Tools → Options → Market Data (in some updates, Tools → Settings → Market Data). Ensure the following options are checked: Get data from server Show Tick Replay Record live data as historical
If you have the NinjaTrader OrderFlow+ subscription or a premium tick-level data feed, EdgeTracker is truly plug-and-play. NinjaTrader's servers handle the bid and ask separation automatically, meaning you do not need to perform any further data fetching. Auto-Theme Confirmation: Upon applying the indicator, it will automatically hijack the chart background and apply its native Midnight dark aesthetic. You do not need to load a separate template to remove blinding white backgrounds; the engine ensures high-contrast visibility immediately.
Standard historical minute data does not contain the bid and ask separation required for Orderflow profiles. While enabling "Record live data" captures this tick stream in real-time, any disconnects, PC sleep cycles, or overnight shutdowns will create gaps in your local database. To fill these gaps without crashing your main chart, you must routinely execute the "Seeder Chart" protocol.
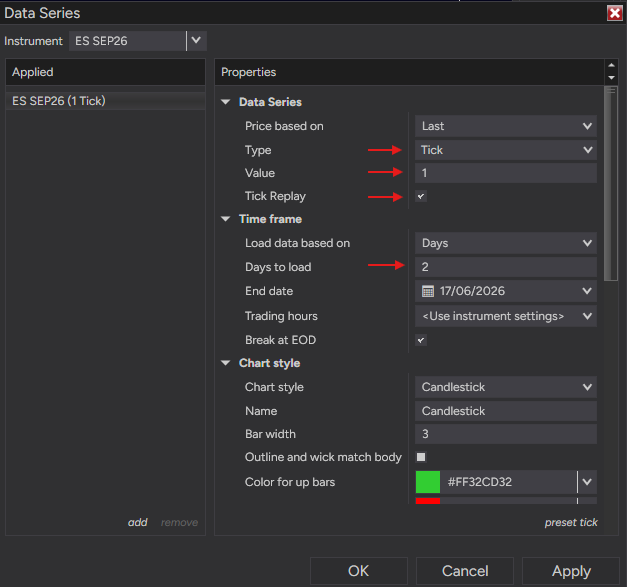
Step 1: Open a completely separate, blank chart.
Step 2: Set the timeframe to 1-Tick. This explicitly forces the server to download the raw tick stream instead of aggregated minute bars.
Step 3: Set the "Days to Load" to 1-2 days (or more, depending on exactly how much time has passed since you were last connected to the data feed).
Step 4: Enable the Tick Replay checkbox in the Data Series for this specific chart and load it.
Step 5: Right-click this Seeder Chart and select "Reload All Historical Data." This forces NinjaTrader to download and cache the missing tick-accurate volume data to your local hard drive.
Step 6: Next, go to your primary EdgeTracker chart, right-click, and select "Reload All Historical Data." Because NinjaTrader can occasionally be buggy with updating its local ledgers, you may need to reload this primary chart twice to force the visual update.
Step 7: (Resource Management): 1-Tick charts are massive resource drainers. Once the data is successfully populated on your main chart, immediately close the Seeder Chart, or change its timeframe away from tick-based to clear the UI queue and prevent system lag.
Section 2: The Philosophy & Engine Logic
Section 3: Custom UI Navigation Guide
Section 4: Core FAQ
Q: Why is the volume for the TPO profiles loading slowly, one session at a time, instead of instantly appearing?
A: EdgeTracker uses an Asynchronous Volume Retrieval Sequence. While the TPO letter structures themselves render instantly, attempting to process massive amounts of historical tick data simultaneously would freeze the NinjaTrader UI and halt live price action. To prevent this, the engine retrieves the volume data sequentially from newest to oldest. This ensures the chart remains "breathing" and fully interactive for trading while the background volume loads.
Q: My dPOC (Developing POC) is missing entirely from the very first periods in my TPO profile. Why?
A: This indicates that the volume data for those specific early periods is incomplete or missing from your local NinjaTrader database. You must execute the Seeder Chart Protocol (loading a separate 1-Tick chart for the necessary historical days) to download the missing tick data, then reload your primary EdgeTracker chart.
Q: Why are the volume text labels missing from the Sidecar and CVP histograms?
A: Volume text labels only render when you are zoomed in sufficiently to match your base Ticks Per Level (TPL) setting. For example, if your base TPL is set to 1, you must be zoomed to a 1-tick vertical resolution. If your base TPL is set to 2, you must zoom to that 2-tick resolution. This ensures there is adequate physical vertical space on your monitor to render the numerical text cleanly.
Q: I clicked and dragged the chart to pan, but the entire EdgeTracker interface disappeared. How do I get it back?
A: You likely accidentally clicked and dragged a profile to the bottom edge of your screen, which forces NinjaTrader to move the indicator into a secondary sub-panel. Because EdgeTracker requires the primary price panel to render its complex architecture, it will disappear if moved. To fix this, open the NinjaTrader Indicators menu (via the top toolbar icon), select EdgeTracker, scroll to the bottom of the properties list, and change the Panel setting back to Same as input series (or Panel 1). This will instantly restore the engine to the main chart.
Q: How do I turn on specific features without constantly opening the NinjaTrader properties menu?
A: EdgeTracker utilizes a dynamic right-click menu system directly on the chart. Right-clicking any individual TPO profile opens its Local Menu (for profile-specific toggles like expanding/collapsing or showing its sidecar). Right-clicking the CVP or the general background area opens the Global Menu. These menus stay open after a selection, allowing you to quickly multitask and toggle multiple features without reopening the menu loop.
Q: Why does the chart abruptly teleport or glitch backward when I try to pan down or look at historical data?
A: You have the Center Price toggle active. Locate the interactive Center Price button at the bottom of the chart and deactivate it. This stops the engine from automatically snapping the camera back to the live spread, allowing you to freely pan the chart.
Q: When I enable a profile's Sidecar, nothing happens and no histogram is visible.
A: The Sidecar is likely hidden behind the TPO profile due to your current chart scaling. Decrease your chart's Bar Width and increase the Bar Spacing. This expands the horizontal canvas and brings the Sidecar into visibility.
Q: Why are the TPO profiles overlapping or looking disproportionately wide/narrow when I zoom?
A: EdgeTracker's structural width relies on native NinjaTrader bar spacing. Because NinjaTrader dynamically scales these dimensions when zooming, your profiles can temporarily misalign. To quickly resolve this, we highly recommend using the native keyboard shortcuts instead of the top menu: Use Alt + Up/Down Arrow to adjust the Bar Width, and Ctrl + Up/Down Arrow to adjust the Bar Spacing. Establishing this hotkey routine is the fastest way to navigate the chart seamlessly.
Q: Why do the letters disappear when I zoom out, and is it possible to see them from a macro view?
A: EdgeTracker dynamically scales the Ticks Per Level as you zoom. The letters will actively render at 1, 2, and 4 TPL. However, once you compress the chart past the 4 TPL threshold, there are no longer enough vertical pixels to render the font, and the engine automatically shifts into "Macro Mode" (rendering solid color blocks instead). To see letters from a higher macro view, you must increase the base TPL setting in the indicator properties, forcing the engine to aggregate more ticks into a single row.
Q: Why are the High Volume Nodes (HVNs) on my Sidecar or CVP clustered very close together?
A: EdgeTrackerʼs internal HVN logic automatically scales with your base Ticks Per Level (TPL) setting, meaning the separation is mathematically adjusted for major standard instruments by default. However, if you are trading an unmapped, highly volatile niche instrument, the baseline sensitivity may catch too much structural noise. To resolve this, locate the HVN section in the properties and manually increase the Min Separation Tick value. You must calibrate this number relative to your specific instrument's average daily range until the micro-nodes are filtered out and only the true macro structural anchors remain.
Q: Why are the volume sidecar histograms sometimes very skinny, and other times full width?
A: EdgeTracker employs a Universal Proportionality Logic. The volume histograms do not arbitrarily stretch to fill space; they are scaled relative to the total volume across all active sidecars. This prevents a low-volume ETH session (e.g., 100K contracts) from looking as visually dense as a high-volume RTH session (e.g., 2M contracts). This logic guarantees an accurate visual representation of relative inventory size.
Q: Why are some Single Print zones colored positively, and others negatively?
A: The color of a single print zone is strictly determined by its spatial relationship to the session's Point of Control (POC). Single prints formed above the POC inherit the positive/buy color, while those formed below inherit the negative/sell color. This structurally maps the directional imbalance relative to the session's core cost basis.
Q: Why are some 30-minute Letter periods missing a POC box when dPOC (Developing POC) is active?
A: The Developing POC operates on a strict mathematical threshold. The engine will not paint a new dPOC box until a price level physically overtakes the volume threshold of the previous highest volume node. If a 30-minute period merely adds volume but does not establish a completely new maximum volume peak for the developing session, the dPOC remains anchored at its previous location.

Appendix A: The Visual Architecture Glossary
Appendix B: The Properties Manual
Appendix C: Shared Brushes & Theme Inheritance
MarketMaker Pro - Wholesale Trading Simulator Docs
Documentation for the standalone simulator application is currently in development.
Support & FAQ
Installation troubleshooting, billing, and technical requirements.
Compatibility & Requirements
Yes, EdgeTracker TPO is fully compiled for and perfectly compatible with the modern NinjaTrader 8.1+ desktop environment.
Absolutely. EdgeTracker parses standard tick and volume data. As long as your prop firm provides Level 1 (Tick) data via Rithmic or CQG, the engine will process the order flow and render the profiles perfectly.
EdgeTracker is universally compatible. While optimized for major futures (ES, NQ, CL, GC), the engine's dynamic Ticks Per Level (TPL) architecture allows it to scale perfectly to equities, forex, and crypto markets.
No. We designed the engine using custom zero-allocation architecture and asynchronous volume retrieval. This ensures that massive historical profile calculations do not freeze the NinjaTrader UI or interrupt your live order latency.
Licensing & Billing
No. Each EdgeTracker license is strictly bound to a single machine's unique hardware identifier (Machine ID) upon its first activation.
If you upgrade your hardware or migrate to a new PC, you do not need to purchase a new license. Simply contact our support team with your License Key, and we will reset your activation instance. This clears your previous Machine ID, allowing you to reactivate the indicator on your new system immediately by reusing the same orignal key recieved at time of purchase.
Yes. You can cancel your monthly subscription at any time through your secure Paddle customer portal and purchase the Lifetime license. Your templates and settings inside NinjaTrader will remain untouched.
Day-1 Troubleshooting
EdgeTracker uses Asynchronous Volume Retrieval. Attempting to process days of historical tick data simultaneously would freeze NinjaTrader. The engine retrieves data sequentially to ensure your chart remains fully interactive while background loading completes. Since this process doesnt overload your UI thread and will not create the classic "freezing" of your chart at heavy load, it keeps the CPU running more efficiantly, making the loading process in total, a lot quicker while at same time enabling you to use the chart and see price freely during the duration of the load.
This means historical volume data is missing from your local NinjaTrader database. Open a standard 1-Tick chart for the required historical days to force NinjaTrader to download the missing data, then reload EdgeTracker.
You accidentally dragged a profile into a sub-panel. Open your Indicators menu, select EdgeTracker, scroll to the bottom, and change the "Panel" setting back to Same as input series.
The "Center Price" toggle is active, snapping the camera back to the live spread. Click the interactive Center Price button at the bottom of your chart to deactivate it so you can freely scroll history.
Need Engine & Algorithmic Details?
For deep-dives into Ticks Per Level math, Single Print mapping, and Sidecar logic, please consult the technical manual.
Contact the Lab
Reach out to our engineering team for technical support or enterprise deployments.
Direct Routing
Technical Support:
support@nordictradelab.com
General Inquiries:
info@nordictradelab.com
Headquarters
Nordic TradeLab
Aalborg, North Jutland
Denmark
Payment Successful
Thank you for choosing Nordic TradeLab. Your secure transaction is complete. Please check your email inbox for your License Key, receipt, and detailed installation routing.
You can now access the full secure documentation by authenticating with the email address used for this purchase.